If you are using a visual representation/image children are intended to relate to, then it is important to choose one that is meaningful and indicates/supports the structure of the intended mathematics.
In the real world children generally see cherries as individual fruits in a carton/punnet, sometimes on a stem, and very occasionally as a pair of fruits on stems linked to the focal point/spur.
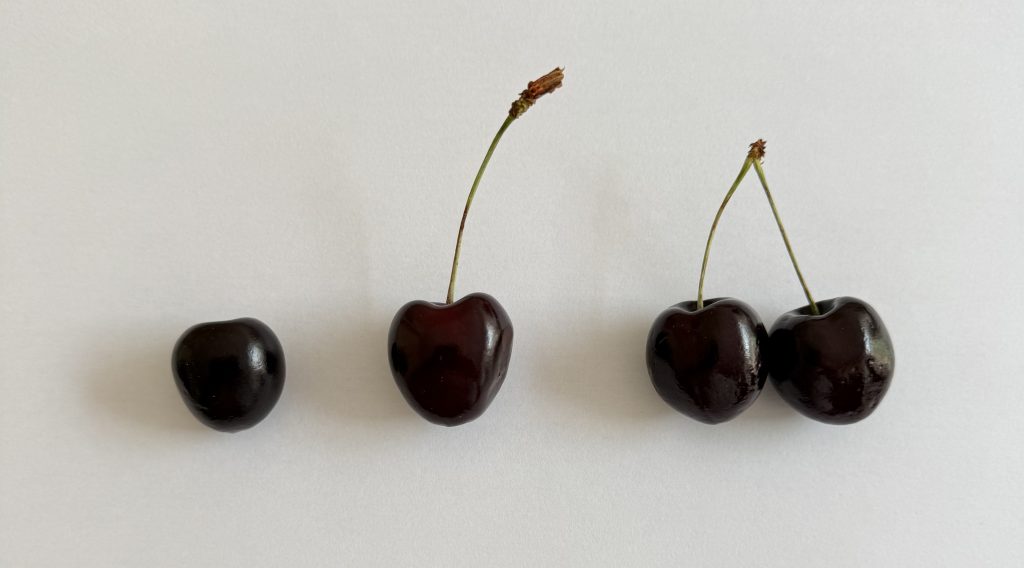
I have yet to see in any punnet of cherries 3 cherries stems linked to the focal point spur (not even in M&S 😁). Maybe because research from fruit growers, suggests pruning by farmers due to under development of a 3rd fruit is prevalent, therefore the concept of a triple is not going to be in the child’s experience and mind.
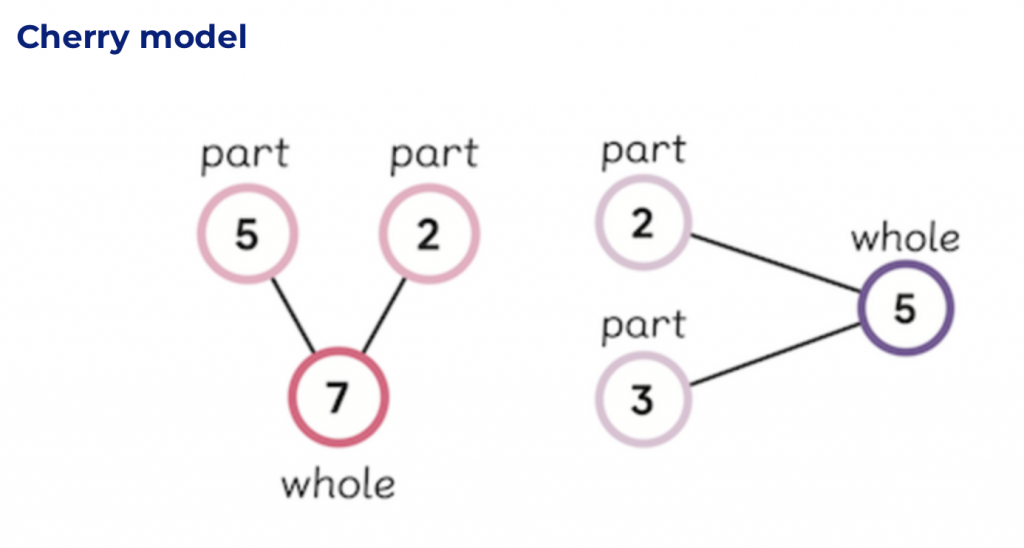
The part whole model promoted by NCETM, as you would expect is mathematically sound – a whole is made up of its parts and supports early understanding of addition and subtraction. However, is the visual used the most appropriate and has it become distorted, misused and potentially a distraction for learning with children – especially as it is not unusual to NCETM representatives, teachers, TAs and children refer to it as the ‘Cherry model’?
You will find examples, some with labels and some without, some in different orientations! From my experience cherries usually hang down on stems from a focal point/spur of a tree, not sideways or upside down as in this example from a school website. My concern continues when the text accompanying the image states “Cherry diagrams are often referred to as ‘part whole’ models in teaching maths” – will parents think Cherry diagrams are a piece of mathematics?
A more appropriate diagram IMO would be a linear tape diagram/bar model, as used in Japan, where the structure of the mathematics is in the visual. The opportunity to introduce this to young learners with objects/drawings represented in the partition can then progress to numerals.
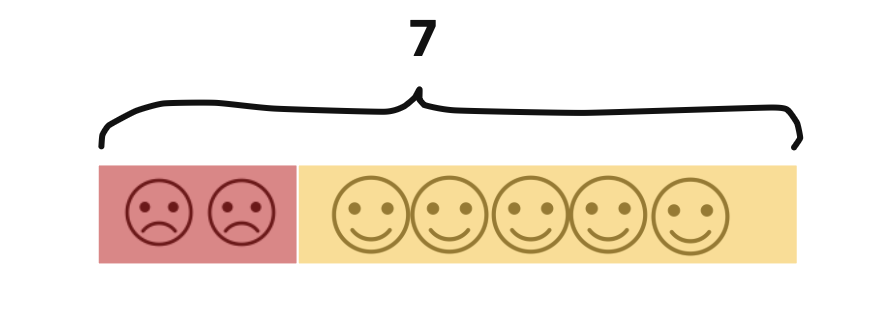
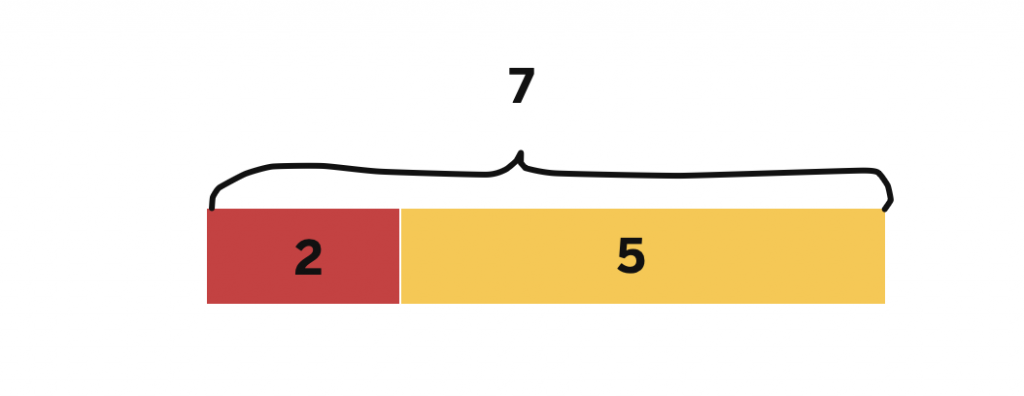
The choice of colours in the example above links with the physical/digital resource of Cuisenaire rods seen below, which I would recommend, demonstrating the linearity of a bar model and a visual with clear mathematical structure .

Digital versions of the cherry diagram are available. One site offers diagrams having up to 5 cherries and different number of values already entered (not to mention the potential for up to 100 diagrams on a printable worksheet). The website refers to them as “Part- Whole Cherry diagrams”. I would question why anyone would consider the need to create a printable worksheet with 100 diagrams!
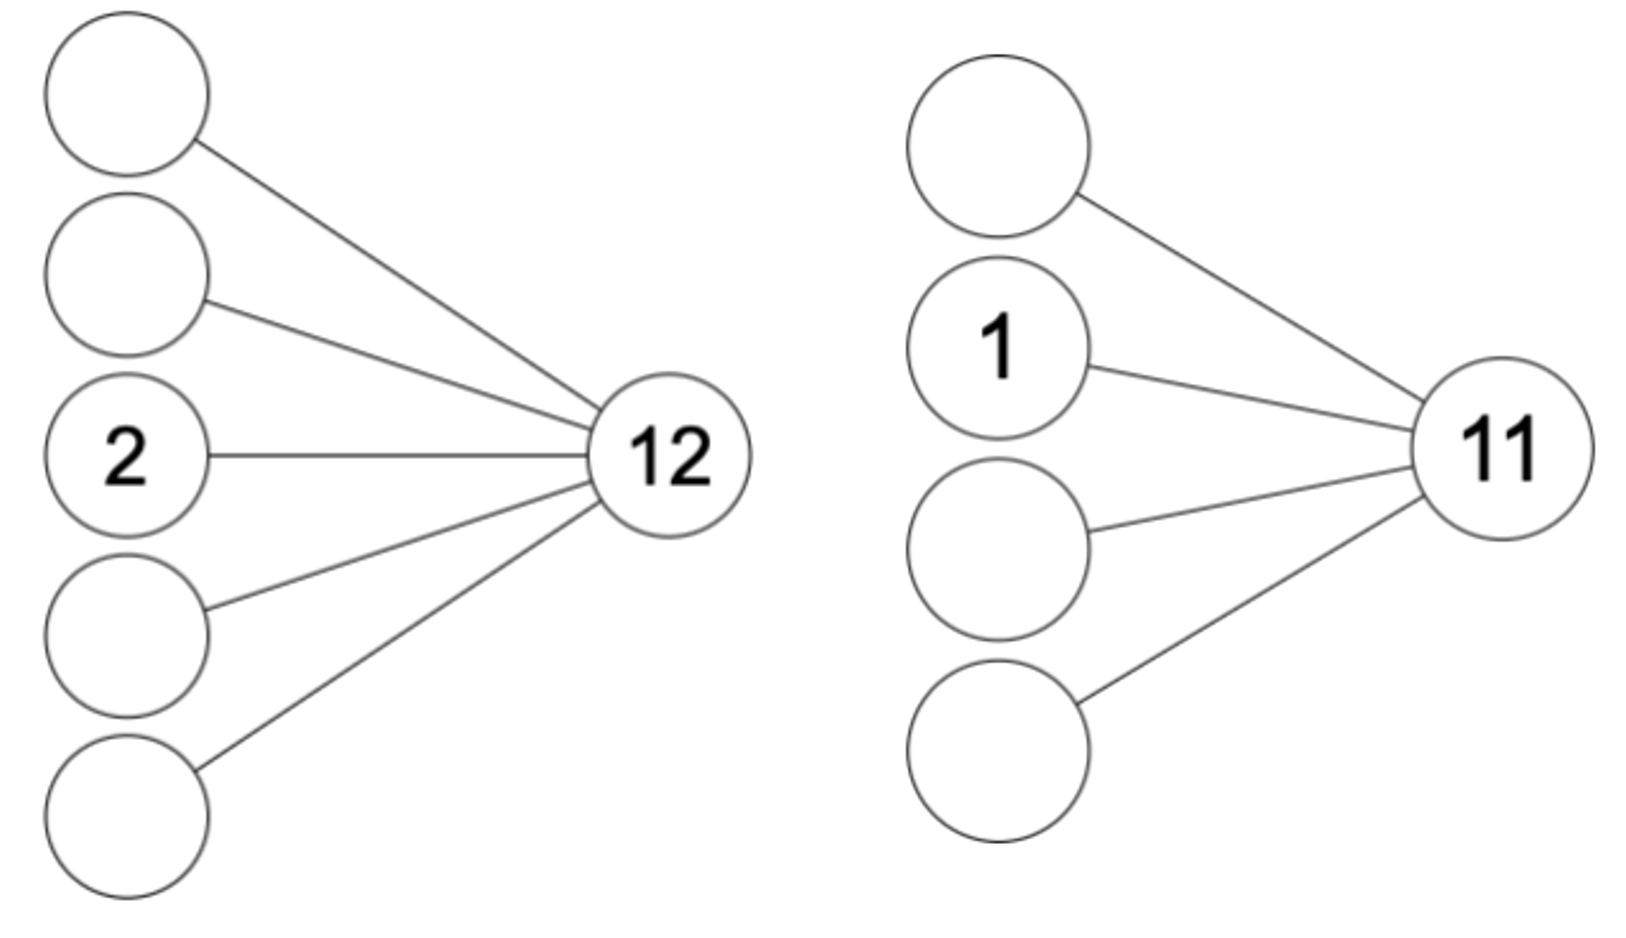
Children need to develop spacial awareness and therefore considering/recognising shapes in different orientations is appropriate. Using the tape diagram, the parts and the whole are self evident in whatever orientation positioned, unlike the ‘cherry diagram’ which has to be labelled to comprehend the intended meaning.
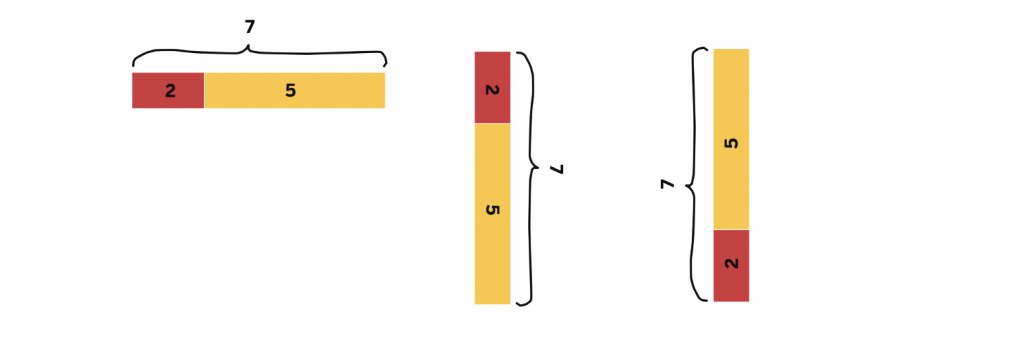
The cherry model is a non proportional representation, whereas the linear tape model even as a sketch conveys proportionality and supports further learning.
The example below is the representation from a problem solving question identified for KS2 & KS3 children described as showing partitioning of a large number.
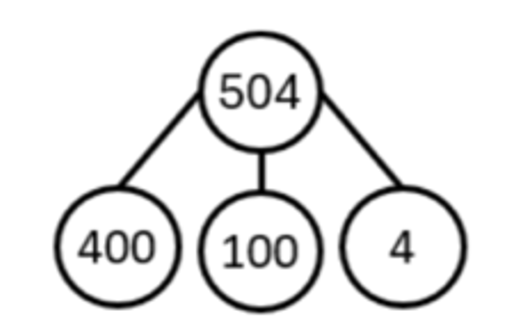
I would suggest a linear tape model offering a sense of proportionality would be preferable? The tape diagram would offer a structural visual of the mathematics and support children’s access to the problem.

In conclusion
I would suggest the linear tape diagram, as used in Japan, should be the ‘go to’ representation for the concept of a whole and its parts, whatever number of parts you may want. Surely a model that makes sense from the beginning with an appropriate connection for KS1, KS2 and KS3 would be advantageous for developing mathematical ideas and progression.
The tape diagram makes the mathematics visible and supports ALL children in their learning by offering:
- flexibility
- connectedness to prior learning
- a sense of the size of the parts
- relationships
- longevity avoiding the learning of tricks
- additive and multiplicative relationships
Leave a Reply