Category: Spatial Reasoning

  • Time to squash the cherries?

    If you are using a visual representation/image children are intended to relate to, then it is important to choose one that is meaningful and indicates/supports the structure of the intended mathematics.

    In the real world children generally see cherries as individual fruits in a carton/punnet, sometimes on a stem, and very occasionally as a pair of fruits on stems linked to the focal point/spur.
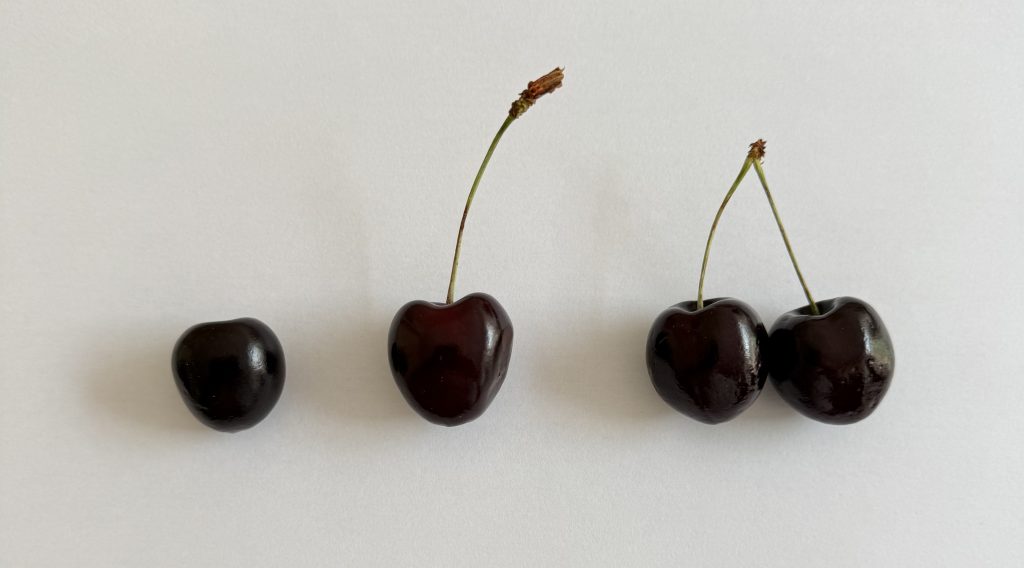
    I have yet to see in any punnet of cherries 3 cherries stems linked to the focal point spur (not even in M&S 😁). Maybe because research from fruit growers, suggests pruning by farmers due to under development of a 3rd fruit is prevalent, therefore the concept of a triple is not going to be in the child’s experience and mind.

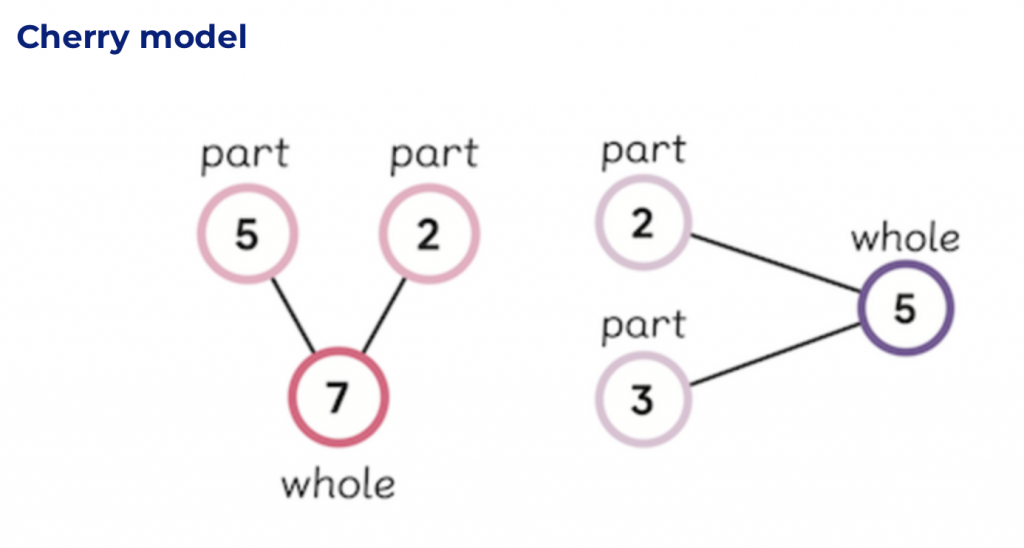
    The part whole model promoted by NCETM, as you would expect is mathematically sound – a whole is made up of its parts and supports early understanding of addition and subtraction. However, is the visual used the most appropriate and has it become distorted, misused and potentially a distraction for learning with children – especially as it is not unusual to NCETM representatives, teachers, TAs and children refer to it as the ‘Cherry model’?

    You will find examples, some with labels and some without, some in different orientations! From my experience cherries usually hang down on stems from a focal point/spur of a tree, not sideways or upside down as in this example from a school website. My concern continues when the text accompanying the image states “Cherry diagrams are often referred to as ‘part whole’ models in teaching maths” – will parents think Cherry diagrams are a piece of mathematics?
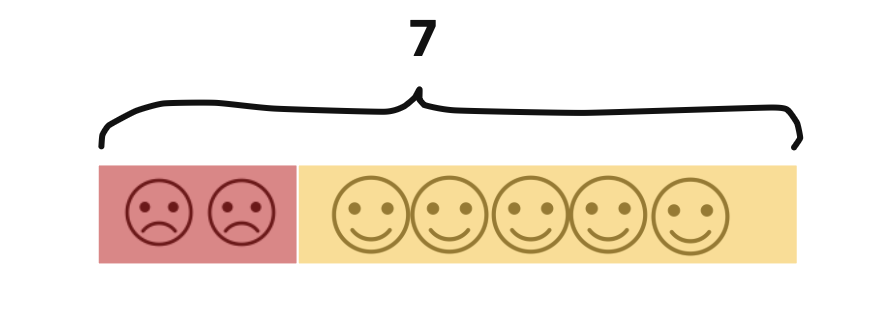
    A more appropriate diagram IMO would be a linear tape diagram/bar model, as used in Japan, where the structure of the mathematics is in the visual. The opportunity to introduce this to young learners with objects/drawings represented in the partition can then progress to numerals.
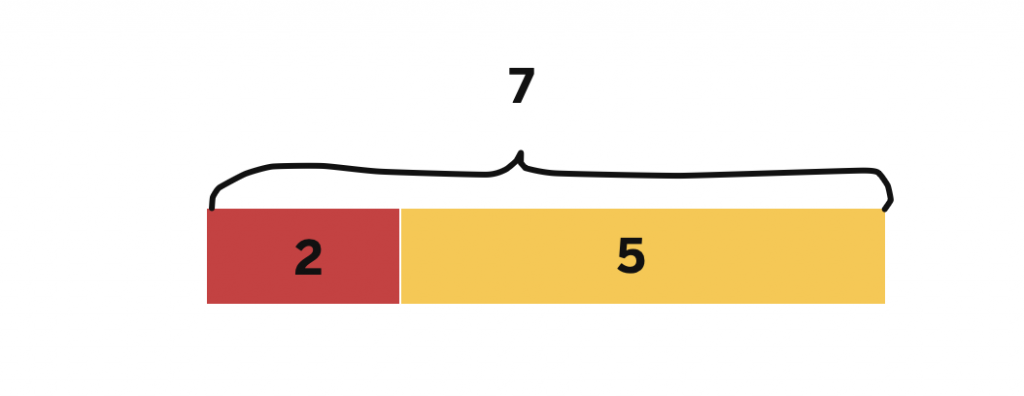
    The choice of colours in the example above links with the physical/digital resource of Cuisenaire rods seen below, which I would recommend, demonstrating the linearity of a bar model and a visual with clear mathematical structure .

    Digital versions of the cherry diagram are available. One site offers diagrams having up to 5 cherries and different number of values already entered (not to mention the potential for up to 100 diagrams on a printable worksheet). The website refers to them as “Part- Whole Cherry diagrams”. I would question why anyone would consider the need to create a printable worksheet with 100 diagrams!
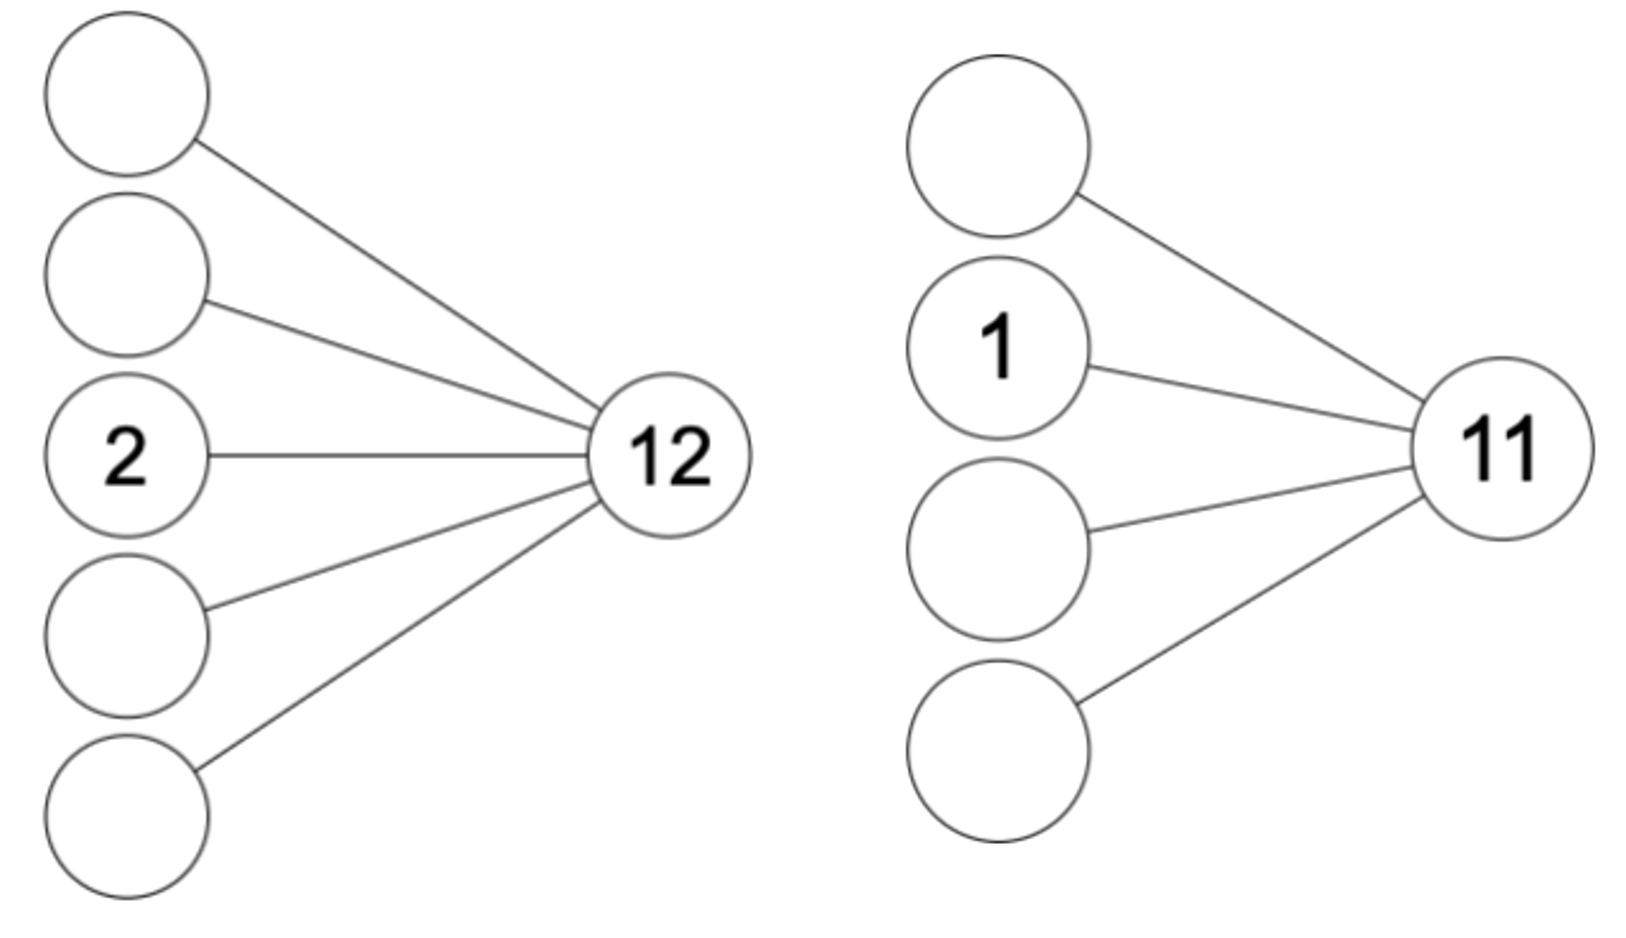
    Website refers to them as Part- whole cherry diagrams

    Children need to develop spacial awareness and therefore considering/recognising shapes in different orientations is appropriate. Using the tape diagram, the parts and the whole are self evident in whatever orientation positioned, unlike the ‘cherry diagram’ which has to be labelled to comprehend the intended meaning.
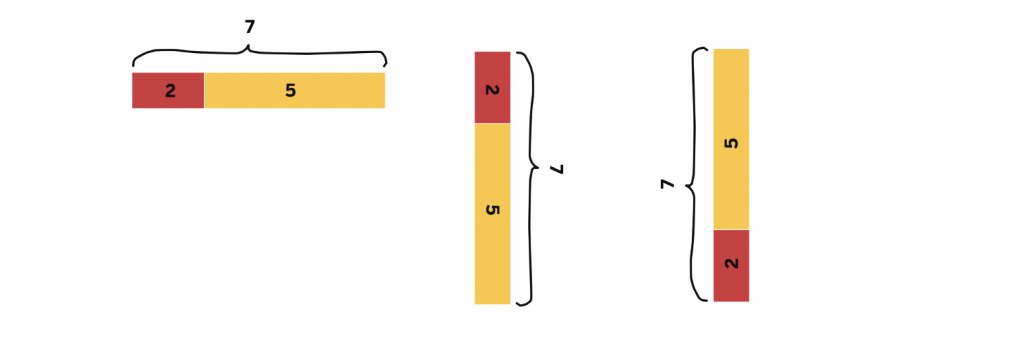
    The cherry model is a non proportional representation, whereas the linear tape model even as a sketch conveys proportionality and supports further learning.

    The example below is the representation from a problem solving question identified for KS2 & KS3 children described as showing partitioning of a large number.
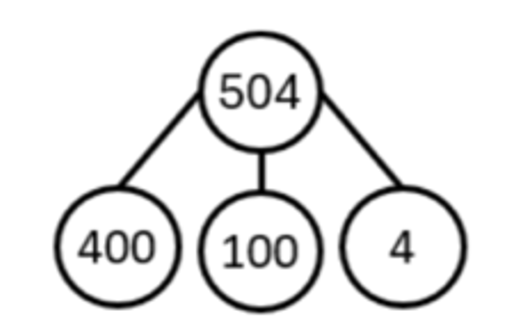
    I would suggest a linear tape model offering a sense of proportionality would be preferable? The tape diagram would offer a structural visual of the mathematics and support children’s access to the problem.

    In conclusion

    I would suggest the linear tape diagram, as used in Japan, should be the ‘go to’ representation for the concept of a whole and its parts, whatever number of parts you may want. Surely a model that makes sense from the beginning with an appropriate connection for KS1, KS2 and KS3 would be advantageous for developing mathematical ideas and progression.

    The tape diagram makes the mathematics visible and supports ALL children in their learning by offering:

    • flexibility
    • connectedness to prior learning
    • a sense of the size of the parts
    • relationships
    • longevity avoiding the learning of tricks
    • additive and multiplicative relationships
  • Visualisation, Spatial Reasoning and AI for Problem Solving in Mathematics.

    Part 1

    It is important to explicitly value the visualising and thinking children engage in and not just focus on the correct final answers.

    Far too often children jump into performing a calculation without appreciating the full task or problem and the ‘components’ actually needed.

    Gestures and talk are likely to be early demonstrations of children’s visualisation, and this is best achieved by delaying access to recording materials, giving children the opportunity to interact before ‘diving into’ a pool of mathematics.

    Children need to have enough time to secure an understanding of the problem and a strategy before they start. It is the need to get ‘a feel’ for the task which I describe as the ‘Build-it’ stage; build a mental image or physically build a representation with manipulatives which enhance the understanding of the problem and helps children consider:

    • what they do know
    • what they need to know
    • what they have enough information to ‘work out’?
    • what information they need to work towards their solution
    • what are the options if they don’t have the mathematical knowledge

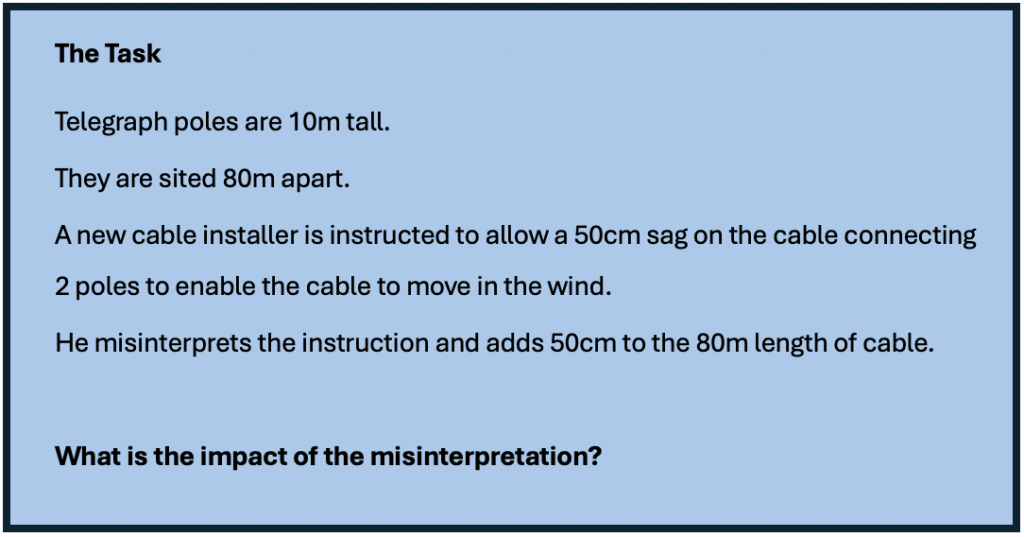
    To demonstrate this approach I gave the task below to a mixed group of secondary school mathematics and science teachers for whom GCSE Mathematics was the common qualification attained but for some it was ‘a quite a while ago’!

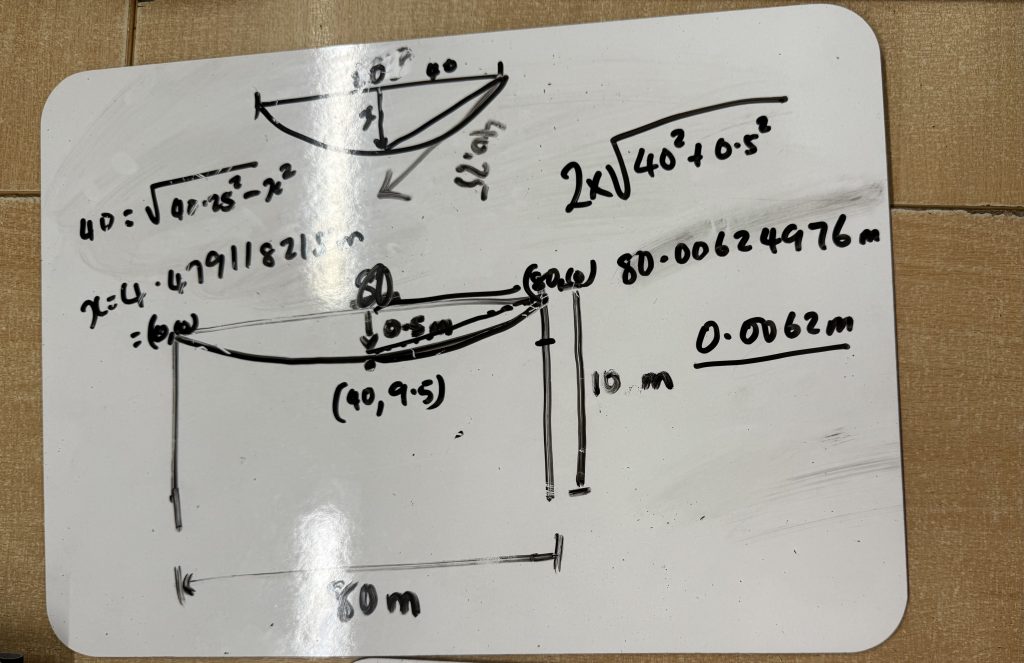
    Teachers started by using their forearms to indicate the vertical telegraph poles and gesturing/ ‘air drawing’ whilst talking about a cable between the posts – “a straight line between the poles will be 80m and the cable should sag below the horizontal”

    Already the shared language is key to supporting visualisation:

    • straight
    • vertical
    • horizontal
    • sag

    Teachers talked of their mental picture of telegraph poles and to appreciating a distance of 80m related to a more commonly recognised distance of 100m track length. When it came to the gesturing the intended sag, the distance between the ends of fingers when pinching the first finger and thumb was an attempt to visualise the ‘smallness’ of 50cm length relative to their poles 80m apart.

    Part 2 – using AI

    It was at this point the teachers sketched on A3 White Boards (an ideal size for collaborative working) a representation of their visualisations and discussions so far; shared gestures, language and reasoning with explanations of:

    • midpoint
    • parabola
    • symmetrical
    • approximating lengths to line segments and calculate using Pythagoras Theorem

    With the information available the mathematics gets more challenging (beyond GCSE) if you want to calculate the exact length of the cable forming an arc of a parabola, and this is where AI can assist. However, AI needs to be asked clear questions!

    Let’s ask for the intended cable with a 50cm sag

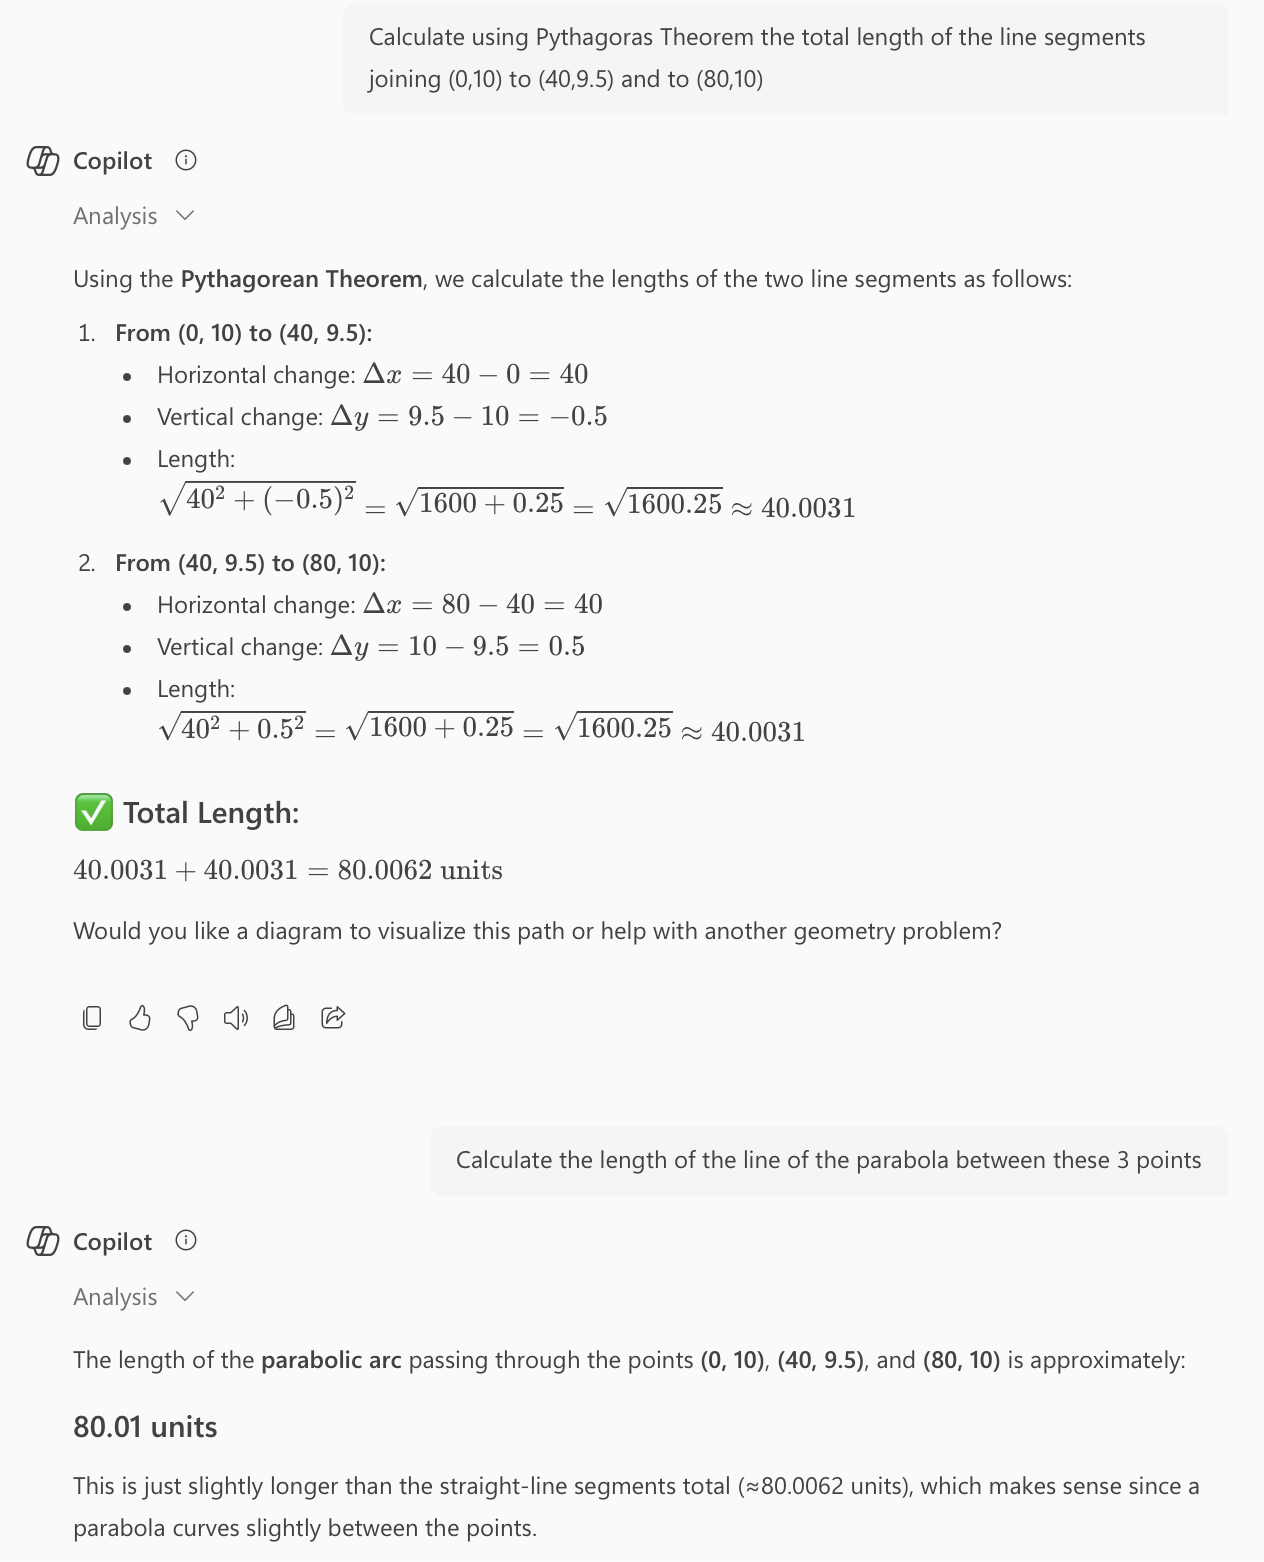
    1. What is the approximated length of the cable using the length of the line segments and Pythagoras Theorem – checking our calculation?
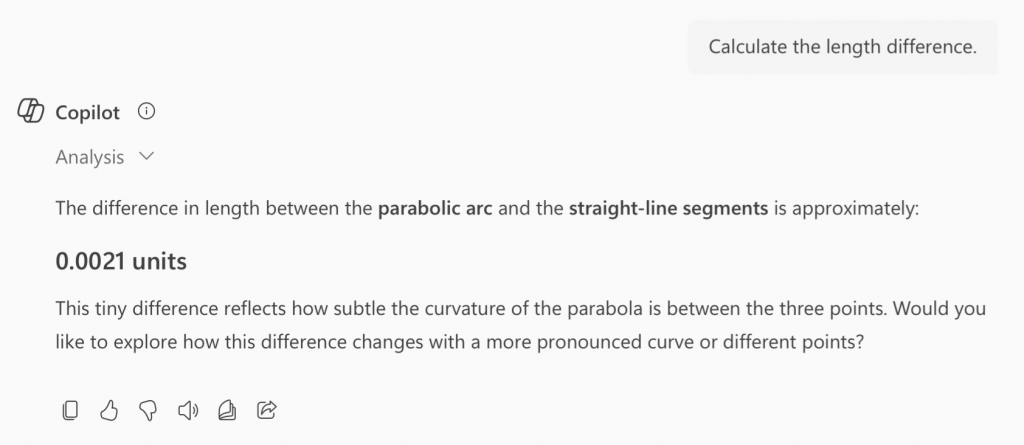
    2. What is the calculated length of the parabola passing through the 3 identified points?
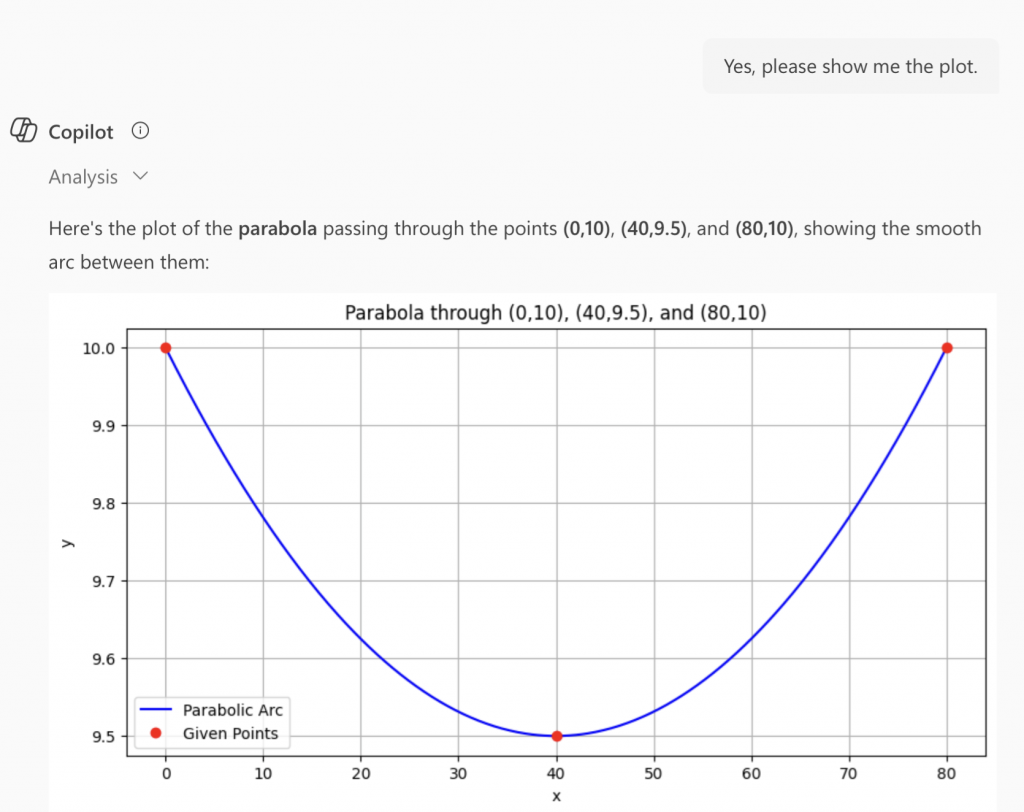
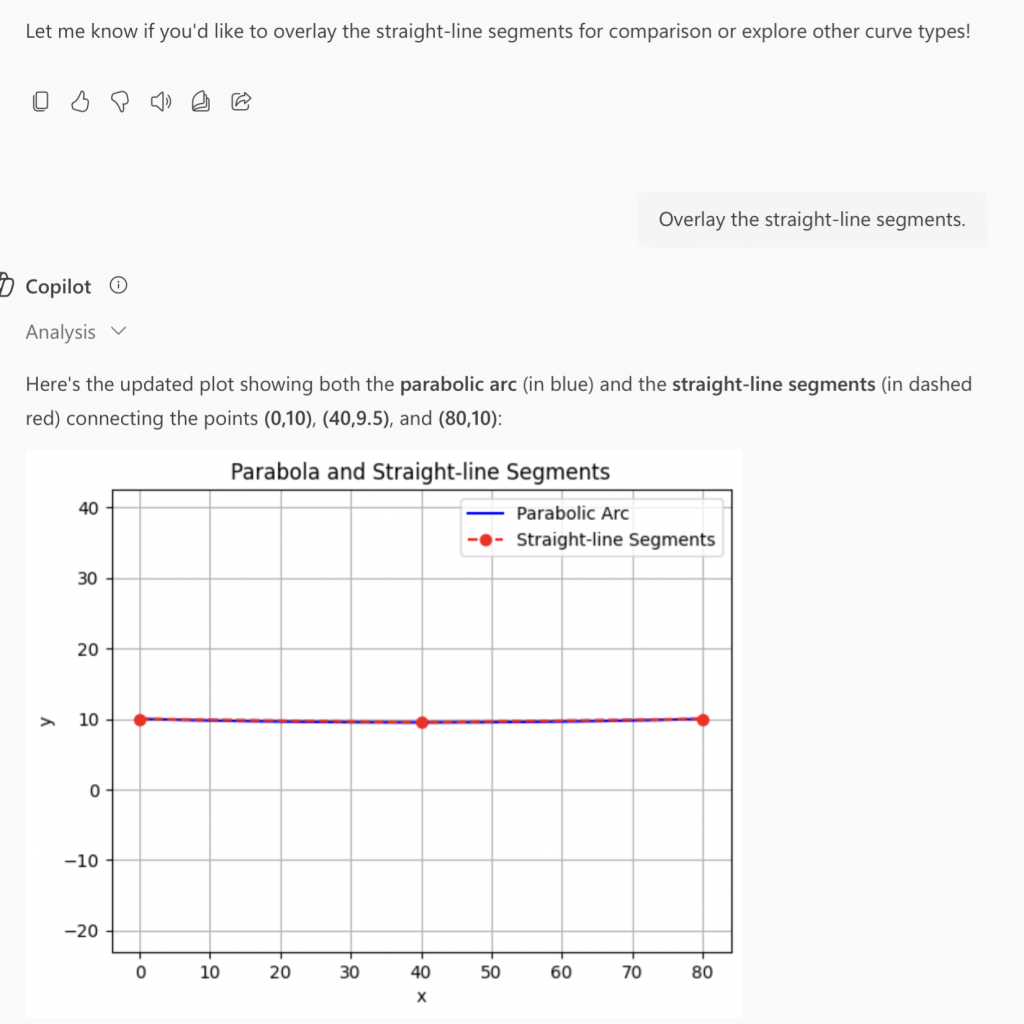
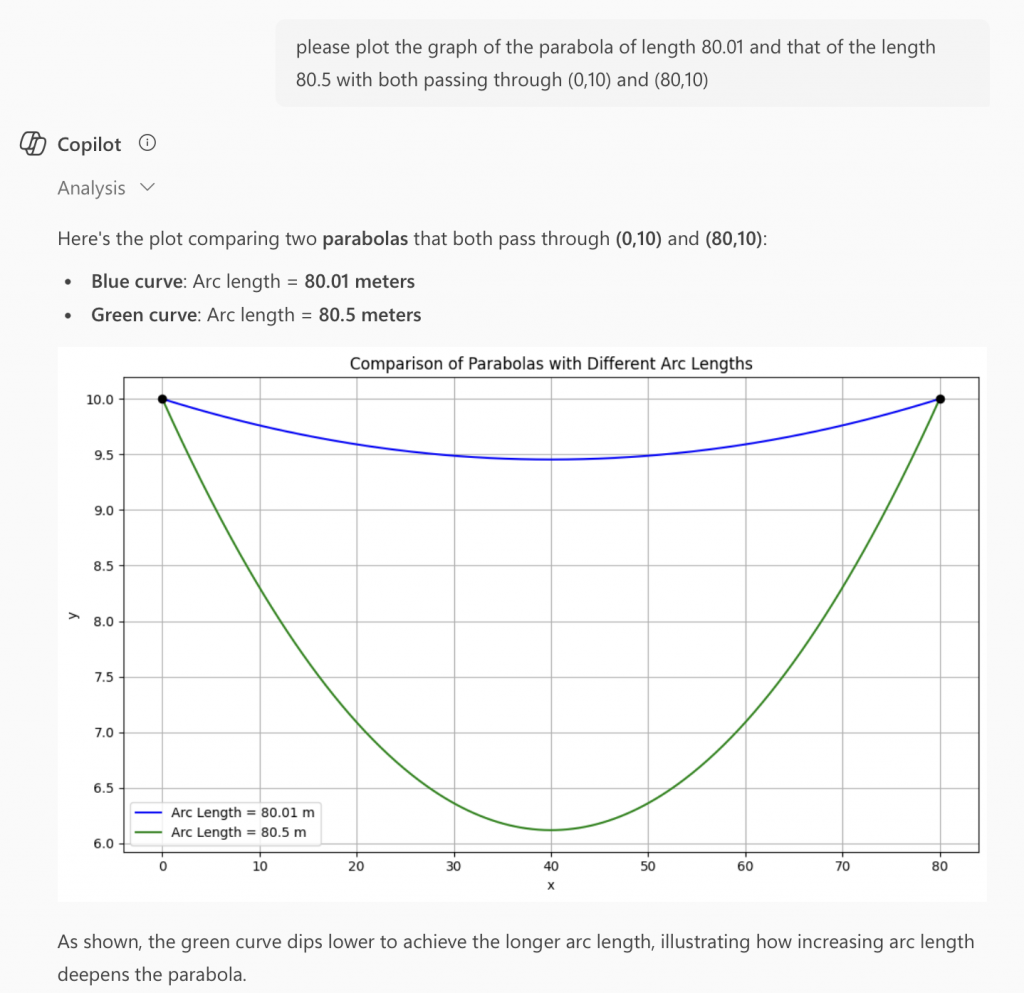
    3. What does a graphical representation of the curve look like ( checking our sketches)?

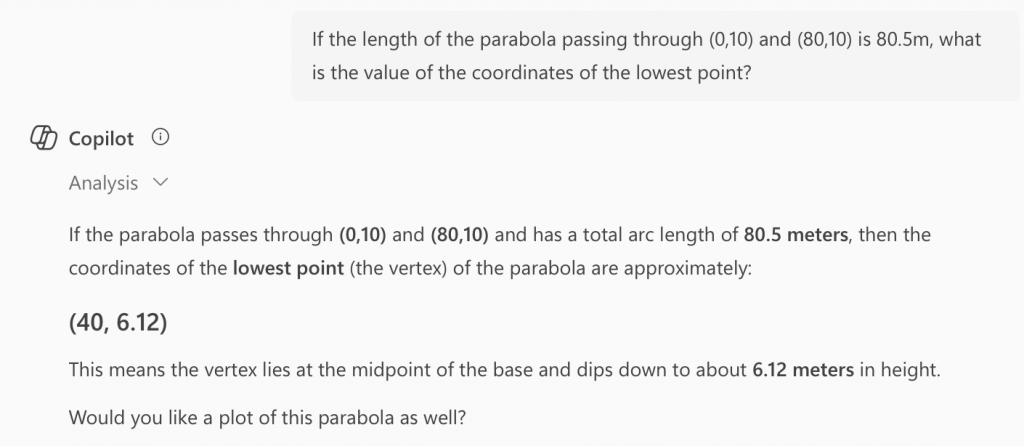
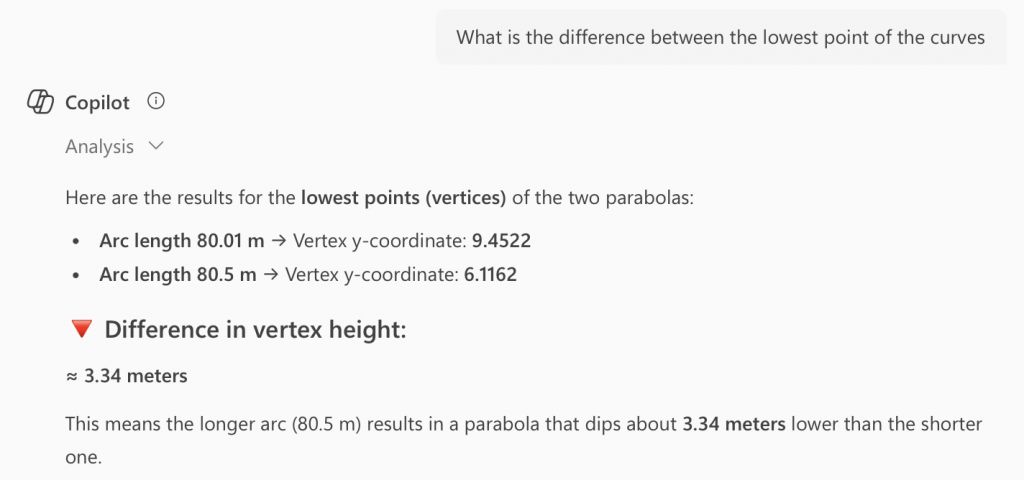
    The following includes our questions to Co-Pilot and the AI responses.

    Now let’s ask about the ‘mistaken’ cable which has a length of 80.5m

    1. What is the lowest point of the parabola passing through (0,10) and (80,10)?
    2. What is the difference between the ‘intended’ sag of the cable and the ‘mistaken’ sag?

    For AI to be useful, students (and teachers) need to

    • follow a logical argument
    • Identify and communicate the requirement of the task – can they describe what they want to build, in detail and guide the process?
    • be curious, collaborative and resourceful
    • ‘guesstimate’, reflect and check reasonableness/accuracy of AI responses

    Supporting Metacognition

    Visualisation, gestures, collaboration and articulating their ideas help children develop the skills needed for problem solving:

    ā€œcomparing different students’ approaches to problem solving and decision making; identifying what is known, what needs to be known, and how to produce that knowledge; or having students think aloud while solving problemsā€ (Costa, 1991)

    Ā The school as a home for the mind: A collection of articles. Corwin. [Google Scholar]

    • Modelling your thinking out loud helps pupils develop their own strategies

    • Resilience is built by teaching children strategies for what to do when they do not know what to do.

    • Identifying appropriate questions to ask in AI can support children as they work towards a solution

  • ‘Make Space – the value of spatial reasoning for Mathematics’

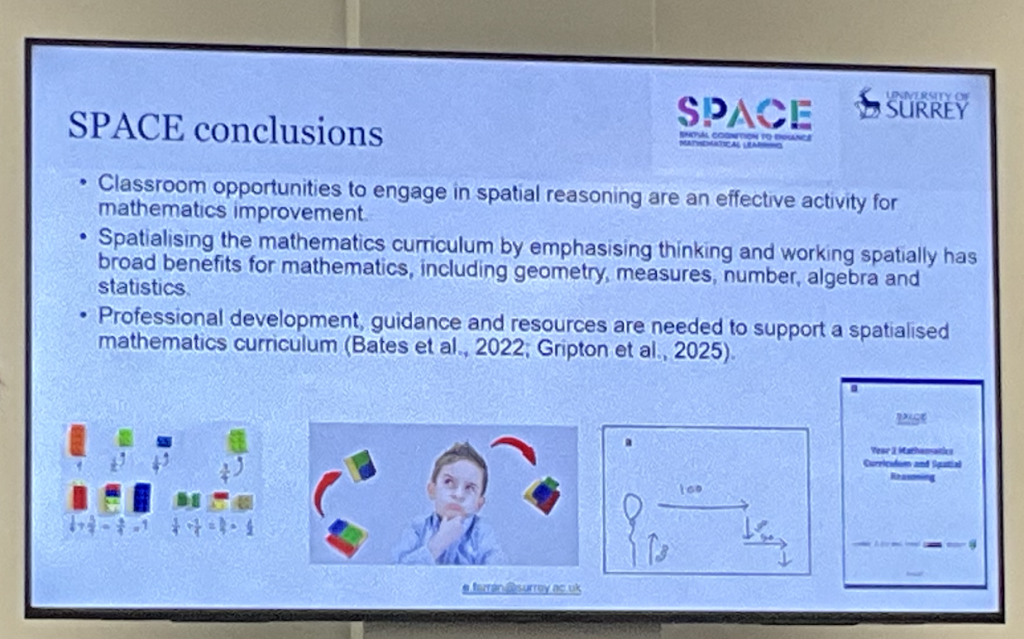
    Privileged to have been invited to ‘Make Space – the value of spatial reasoning for Mathematics’ event led by Emily Farran at Surrey University this week.

    Some key reflections:
    1. Spatial abilities can be trained and increases achievement in mathematics
    2. Spatial reasoning is intrinsic to learning in all domains of mathematics
    3. Spatial reasoning leads to flexible thinkers
    4. Mental maths questions should be include spacial reasoning.
    5. Spatial reasoning is for EYFS to adult
    6. Spatial reasoning should not be ‘bolt on’ to the curriculum
    7. The use of technology for spatial reasoning is currently underdeveloped in UK

    CPD will be key to making an awareness of the importance of spatial reasoning and developing strategies with teachers to use in the classroom.